The interface
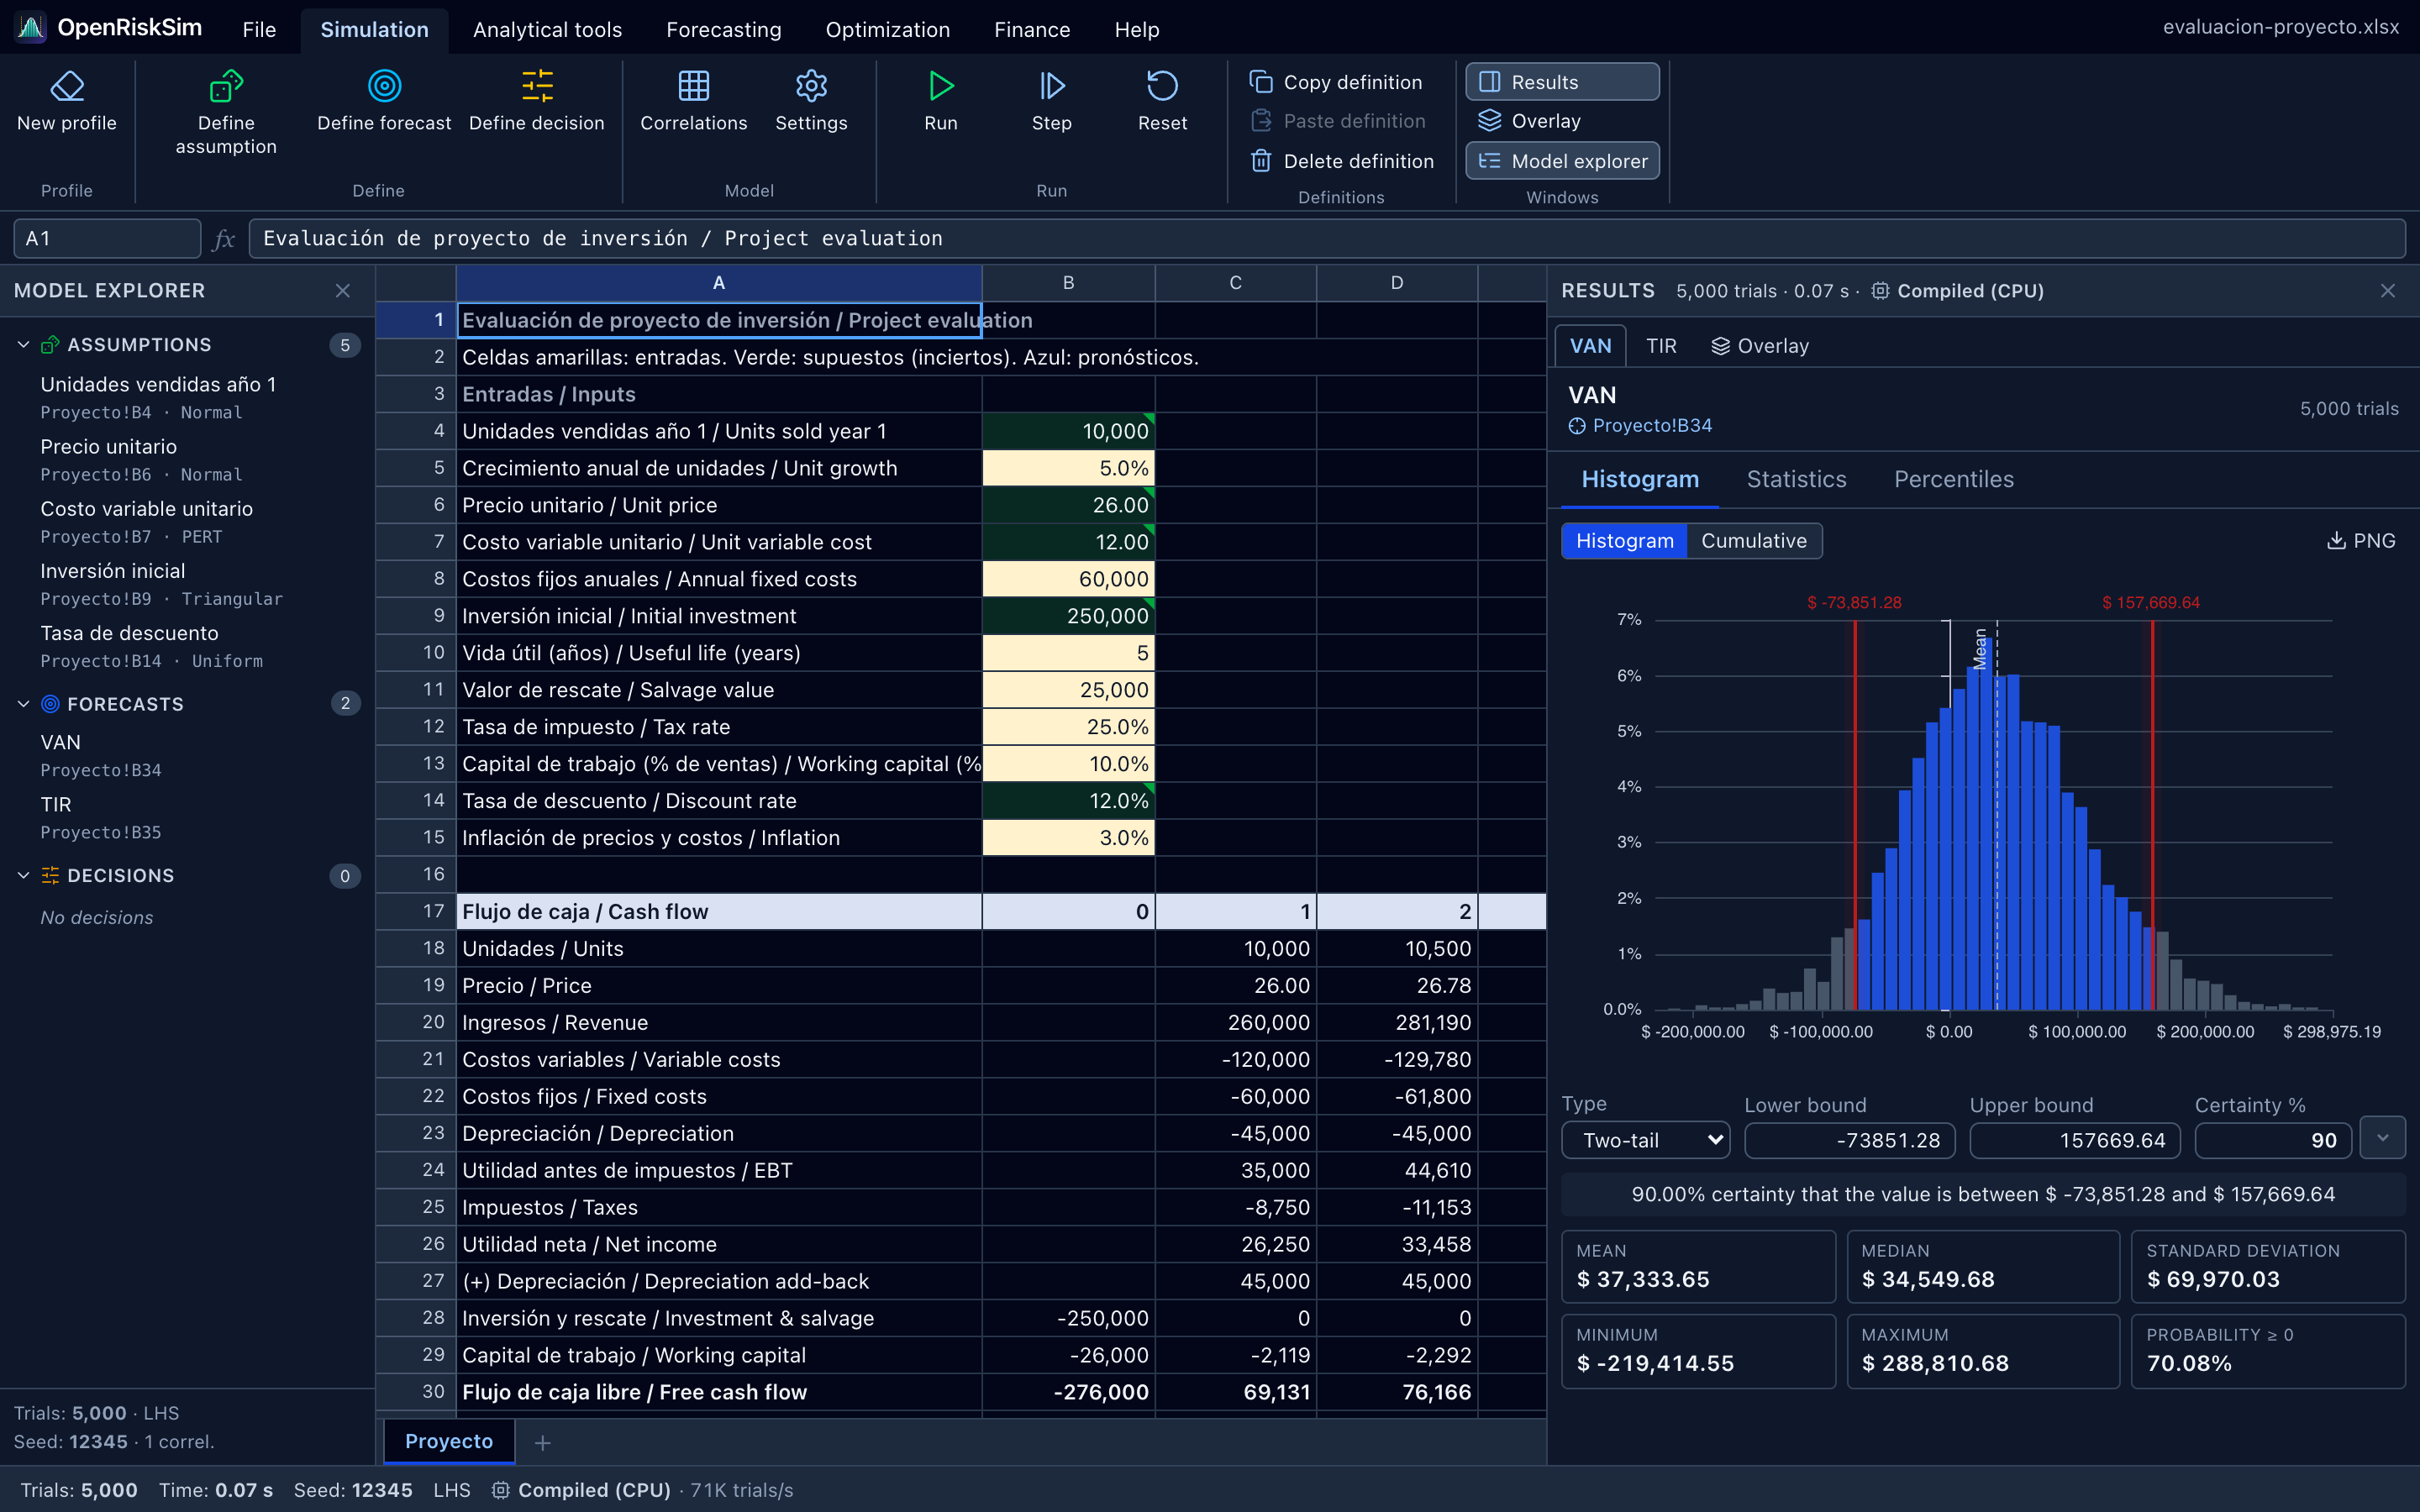
The OpenRiskSim window follows the layout of Excel with Risk Simulator: a ribbon at the top, the spreadsheet in the centre, the model explorer on the left, the results panel on the right and the status bar at the bottom.
The ribbon
The ribbon has seven tabs. The names in these tables are exactly the ones on screen (English interface).
File
| Group | Button | What it does |
|---|---|---|
| Workbook | Open | Opens an .xlsx workbook or a .csv file (Ctrl+O). You can also drag the file onto the window. |
| Examples | Ready-made models to practise with (see below). | |
| New workbook | Creates a blank workbook (Sheet1). | |
| Save & export | Save .xlsx | Downloads the workbook with the risk model included (Ctrl+S). |
| Export report | Report of the last simulation as .xlsx, PDF or HTML. Enabled after running. | |
| Preferences | Español / English | Switches the interface language. |
| Dark theme / Light theme | Switches the appearance. |
The bundled examples are:
| Example | What it teaches |
|---|---|
| Project evaluation | 5-year cash flow with NPV, IRR and payback; price and units negatively correlated. Basis of the tutorial. |
| Inventory (newsvendor) | Poisson demand; decision variable “order quantity”; forecasts profit and fill rate. Great for optimization. |
| Investment portfolio | Four assets with correlated normal/lognormal returns; weights as decision variables. |
| Product launch | Discrete events: regulatory approval (Bernoulli) and number of distributors (binomial). |
| Loan & equity cash flow | Debt-financed project with a floating rate; equity NPV and IRR and minimum DSCR. |
Simulation
| Group | Button | What it does |
|---|---|---|
| Profile | New profile | Clears the model: removes all assumptions, forecasts, decisions and correlations. The sheet is not changed and the settings are kept. |
| Define | Define assumption | Assigns a distribution to the active cell (Alt+A). See Assumptions. |
| Define forecast | Marks the active cell as an output (Alt+F). See Forecasts & decisions. | |
| Define decision | Marks the active cell as a decision variable (Alt+D). | |
| Model | Correlations | Correlation matrix between assumptions (Alt+C). Needs at least two enabled assumptions. See Correlations. |
| Settings | Trials, seed, sampling method, correlations and precision control. See Running. | |
| Run | Run / Stop | Runs the simulation (Alt+R); while running the button becomes Stop (Esc). |
| Step | Runs a single trial and shows the simulated values in the sheet (Alt+S). | |
| Reset | Clears results and restores the original sheet values (Alt+X). | |
| Definitions | Copy definition / Paste definition / Delete definition | Copies the active cell's definition and pastes it into every selected cell, or deletes the definitions in the selection. |
| Windows | Results | Shows or hides the results panel. |
| Overlay | Opens the comparison of several forecasts in one chart (after running). | |
| Model explorer | Shows or hides the left panel. |
Analytical tools, Forecasting, Optimization and Finance
These four tabs open tools in their own windows:
- Analytical tools: Tornado, Spider chart, Sensitivity, Scenario table, Distribution fitting, Bootstrap, Hypothesis test, Descriptive statistics, Overlay chart. → Analytical tools
- Forecasting: Time series, Multiple regression, Stochastic processes. → Forecasting
- Optimization: Optimization. → Optimization
- Finance: Project evaluator, NPV/IRR calculator, Loan amortization, Depreciation, Cost of capital, Break-even, Scenario analysis. → Finance
Each tool has a “What does it do?” box with a short explanation and most have an Export to sheet button that copies the results to a new sheet.
Help
Quick start (F1), Distribution glossary, Keyboard shortcuts and About (licence and credits).
The spreadsheet
The sheet works like Excel: click a cell, type and press Enter. Above it are the name box (shows the active cell; type a reference such as B34 or Proyecto!B34 and press Enter to jump there) and the formula bar. Below are the sheet tabs and the + button (Add sheet).
Right-clicking a cell opens a menu with Define assumption, Define forecast, Define decision, Copy definition, Paste definition, Delete definition and Clear contents.
Cell colours
| Colour | Meaning |
|---|---|
| Green | Assumption (uncertain input) |
| Blue | Forecast (output) |
| Yellow | Decision variable |
Defined cells also carry a small triangular marker in the corner. (Some workbooks, like the examples, also use a light-yellow fill for fixed “inputs”; that is just sheet formatting.)
Sheet shortcuts
| Key | Action |
|---|---|
| F2 or double-click | Edit the active cell |
| Enter / Tab | Commit and move down / right (Shift reverses) |
| Esc | Cancel editing |
| Shift+arrows | Extend the selection |
| Ctrl+arrows | Jump to the data edge |
| Ctrl+A | Select the whole sheet |
| Ctrl+Home | Go to A1 |
| Page Up / Page Down | Scroll one screen |
| Ctrl+C / Ctrl+X / Ctrl+V | Copy, cut, paste (compatible with Excel and Google Sheets ranges) |
| Ctrl+Z / Ctrl+Y | Undo / redo |
| Delete / Backspace | Clear the selection contents |
On macOS you can use ⌘ instead of Ctrl. Full list in Keyboard shortcuts.
Formulas
The formula engine is Excel-compatible (HyperFormula, almost 400 functions): =SUM(B2:B9), =NPV(B14,C30:G30)+B30, =IRR(B30:G30), =IF(B23>0,1,0), =PMT(…), =VLOOKUP(…)…
Spanish-speaking users can also type formulas as in Spanish Excel — =SUMA(…), =VNA(…), =TIR(…), =SI(…) — with ; as the argument separator. They are translated to English names with commas when committed, which is how .xlsx files store them anyway.
Details to keep in mind
- With the Spanish interface, numbers typed in cells use a decimal comma (
12,5); with the English interface, a decimal point. Inside formulas always use a decimal point (=B4*1.05). - As in Excel,
NPVdiscounts from the first value: add the year-0 investment separately (=B30+NPV(rate,C30:G30)).
Model explorer
The left panel shows the model tree: Assumptions, Forecasts and Decisions, each with its name, cell and distribution or type. Hovering an item reveals buttons to go to the cell, show the results chart (forecasts), edit and delete. At the bottom it summarises the settings: number of trials, method (MC or LHS), seed and number of correlations.
Results panel
After Run, the right panel shows one tab per forecast (e.g. VAN and TIR in the example) plus Overlay. Each forecast has three tabs: Histogram, Statistics and Percentiles. Everything is explained in Interpreting results.
If you change the model or the sheet after simulating, a “Results out of date” notice appears with a Re-run button.
Status bar
- With several numeric cells selected it shows Average, Count and Sum, like Excel.
- During a simulation it shows progress (Simulating… 45%) and a Stop button.
- In step mode it shows the current trial with Next trial and Restore values buttons.
- When finished it shows Trials, Time, Seed, the sampling method and the backend used with its speed (e.g. GPU · apple metal-3 · Metal; see Acceleration), plus warnings such as trials with errors, “precision reached” or the Fallback chip.
Language and theme
- File → Español / English switches the whole interface language (and number formatting:
1.234,56in Spanish,1,234.56in English). - File → Dark theme / Light theme switches the appearance.
Both preferences are remembered by the browser.